Three White Soldiers Or An Advance Block?
Recent S&P 500 action resembles two different candlestick patterns
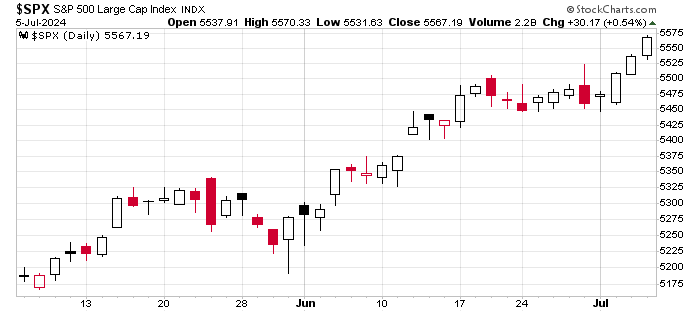
The last three days of trading (July 2,3, and 5, 2024) have printed an interesting series of candles for the S&P 500. How you interpret them will lead to different implications about how to proceed in the coming days. Is it an example of a Three White Soldiers chart pattern? Or does it resemble more an Advance Block?
If this is Three White Soldiers there are usually higher prices to come, possibly after a short consolidation.
If an Advance Block, however, prices may be capped for the near future.
We are going to zoom in on the last three candles on the chart above. But, as always, what has happened in the recent past is also relevant. Evaluating candlestick patterns without context is not a path to success.
The Case For And Against Three White Soldiers
Several conditions should be met to create this bullish chart pattern:
There should be three long, white candles — We all have our own ideas about what counts as “long”. These candles are not particularly long.
They should close near the high of the day — Again, how near does “near” need to be is open to interpretation. By almost anyone’s definition, the market closed near the high for the day on all three days.
There should be consecutively higher highs — Yes, this is clearly what we have here.
The pattern should follow a period of declining or stable prices — Maybe this qualifies? There certainly is not a downtrend here, but you could make the case that the short consolidation during the previous two weeks is enough to check this box.
So what we have here is not an obvious case of Three White Soldiers. Some say that closing near the highs is the key ingredient. If you want to emphasize that, then you can probably conclude that we do have Three White Soldiers here.
What if this is really an Advance Block?
For an Advance Block, we would see diminished strength in each next candle in this three-candle setup. Or, at a minimum, the last two candles should be weaker than the first.
This is what has happened here. The bodies of the second and third candles are nearly identical in size, but both are clearly smaller than the first candle.
Also, an Advance Block is something we are more likely to see at higher prices. With the S&P 500 hitting new all-time highs with each successive close, I think we can agree this counts as “high prices”. In Steve Nison’s famous book, Japanese Candlestick Charting Techniques, he writes “(b)e especially cautious about this pattern during a mature uptrend.”
If you see the current situation as an Advance Block, it is important to remember that, strictly speaking, this is not a bearish candle pattern. A downturn could happen. Or there could simply be a period of stagnant prices.
So, which is it?
I lean towards Advance Block. But if, armed with the information presented above, you see it as Three White Soldiers that would not be an unreasonable interpretation.
More charts
Day Hagan tweeted a panel of charts about commodities, and what it could mean for inflation.
Charlie Bilello points out that the Bloomberg US Aggregate Bond Index is still down 10.4% from its peak from nearly four years ago.
Almanac Trader finds that the market tends to be weak in the days after the July 4th holiday.
Numbers only
40% - Just two stocks - Exxon and Chevron - account for 40% of XLE 0.00%↑ , the popular energy stocks ETF.
$2.25 - The price of natural gas is down 24% from the high on June 11, but still up 28% since May 1.
444000 - TSLA 0.00%↑ announced that it had delivered 444 thousand vehicles in the second quarter of this year, up from 387 thousand in the previous quarter. Shares went up 25% over the following week.


