Shares of First Solar (FSLR) are down more than 20% this month, and October still has another week to go.
Are sellers exhausted yet? Or is there more pain to come? The charts offer a ray of hope, but at the same time there is a risk of getting burned if you do not acknowledge the risks.
We will focus this analysis on a weekly chart going back two years.
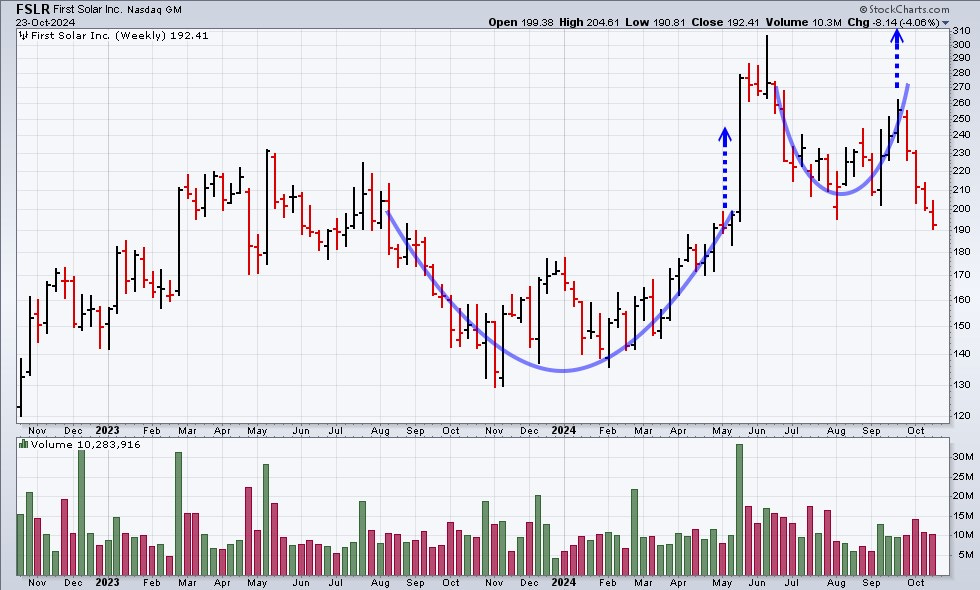
Let’s begin with where we are: the $200 level. This is where the stock was back in the spring when it launched, and later served as support in August. The round number effect is also in play here. There are some who say that there is no logical reason for stock prices to respect big round numbers. But they do. The psychological importance of such numbers is real.
Will the magical $200 number put a floor under prices again, as it did in August? It can, but there is no reason why it must. FSLR has now actually fallen below that level and currently sits at $192. The market has a way of slightly overshooting perceived important price levels. However, being 4% below that point is not a good look.
Moving on to trading volume, what should we make of those spikes in volume that always coincided with jumps in prices? Well, normally we would think of those as a big positive for the stock. It would indicate increasing demand for shares and higher prices ahead. But that did not always happen here. There was not any sustained buying after the initial spikes. The next week or two often saw lower prices.
Finally, there are those two basing patterns on the chart. The cup-and-handle pattern is a classic bullish formation. Sometimes, particularly strong stocks do not even bother with the handle and once the right hand side of the cup is formed they continue to surge upward. This is exactly what happened in May and FSLR went up by 35% in the blink of an eye.
The same thing could have (should have?) occurred in the second base. But just as the shares were about to finish forming the right side of that second cup, the market revolted. When prices don’t do what they are supposed to do, that is important and useful information. That prices ran so fast in the other direction is not surprising. And that failure to complete the second base has brought us back to… $200.
Adding it all up, it is hard to have much confidence in FSLR. If $200 is going to hold as an important support level, it needs to get back (up) there this week. We think the more likely scenario is that the “polarity principle” comes into play and $200 becomes an area of resistance.
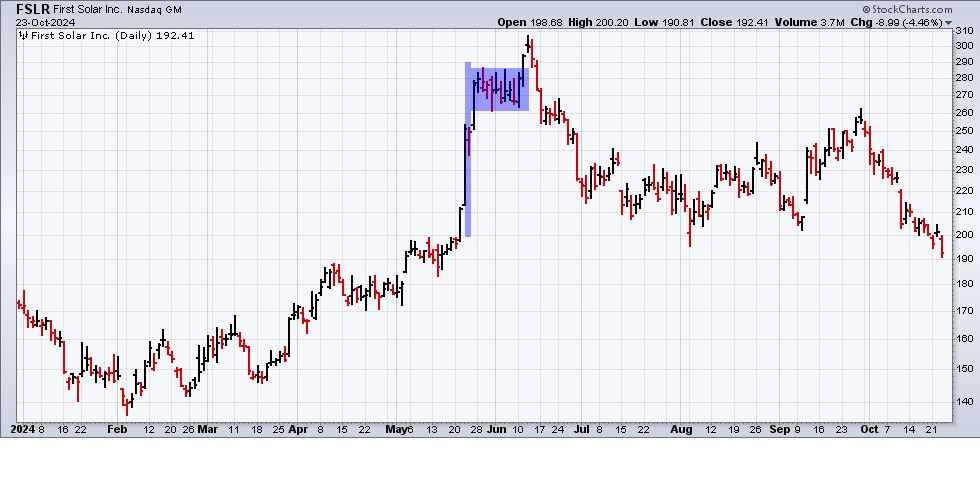
Bonus chart: FSLR daily
While this week’s featured chart discussed the FSLR weekly chart, there is one particular element of the daily chart that stood out to us.
Take a look at that glorious textbook bull flag right there in the middle of the chart!
The outsized, nearly vertical, rise followed by a period of sideways chop should lead to further gains. When prices broke above the consolidation area all seemed normal. But when price quickly reversed, that was a major red flag. Every good technical analyst knows that “from failed moves come fast moves” in the other direction. Pithy, but often true.
FSLR dropped from $300 to $200 in six weeks.


